KPI Graph Report Templates
Three MS Excel format fully editable and customisable Key Performance Indicator Graphs (KPI Graphs).
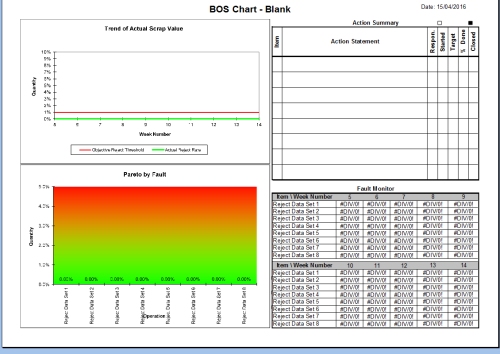
- Pareto Chart (BOS Chart)
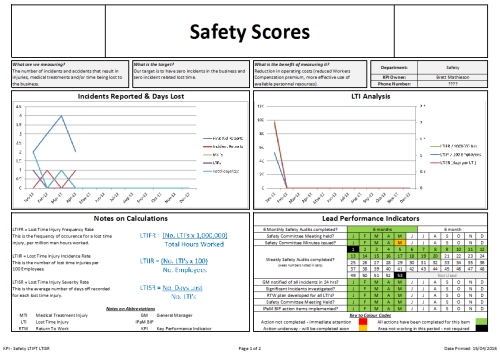
- Safety Report (includes LTIFR, LTIIR and LTISR)
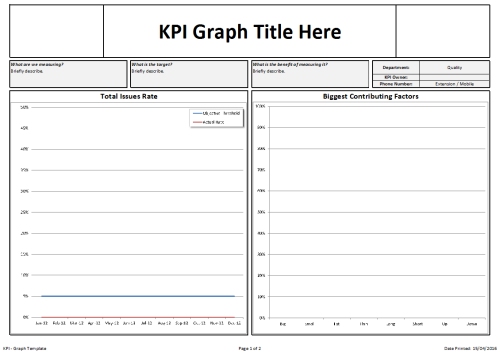
- KPI Template with action plan
All have a formatted report page displaying graphical data and all include a common format data chart that automatically updates and drives the graphing.
Very easy to use by anyone with MS Excel experience. WIll save many hours of work setting them up by using these templates, as all of the hard work is done - you just need to input your data.
The three files are packaged in a ZIP file.
If you need help picking and implementing your KPI system, we can help. Training and implementation can be done quickly and efficiently plus our experience in picking the right KPI's will drive increased financial performance sooner, giving a larger return on investment quicker.
Price : $5.00